
The Illusion Of Lab Grade Accuracy At Home

Why DIY Tests Often Miss Critical Nuances
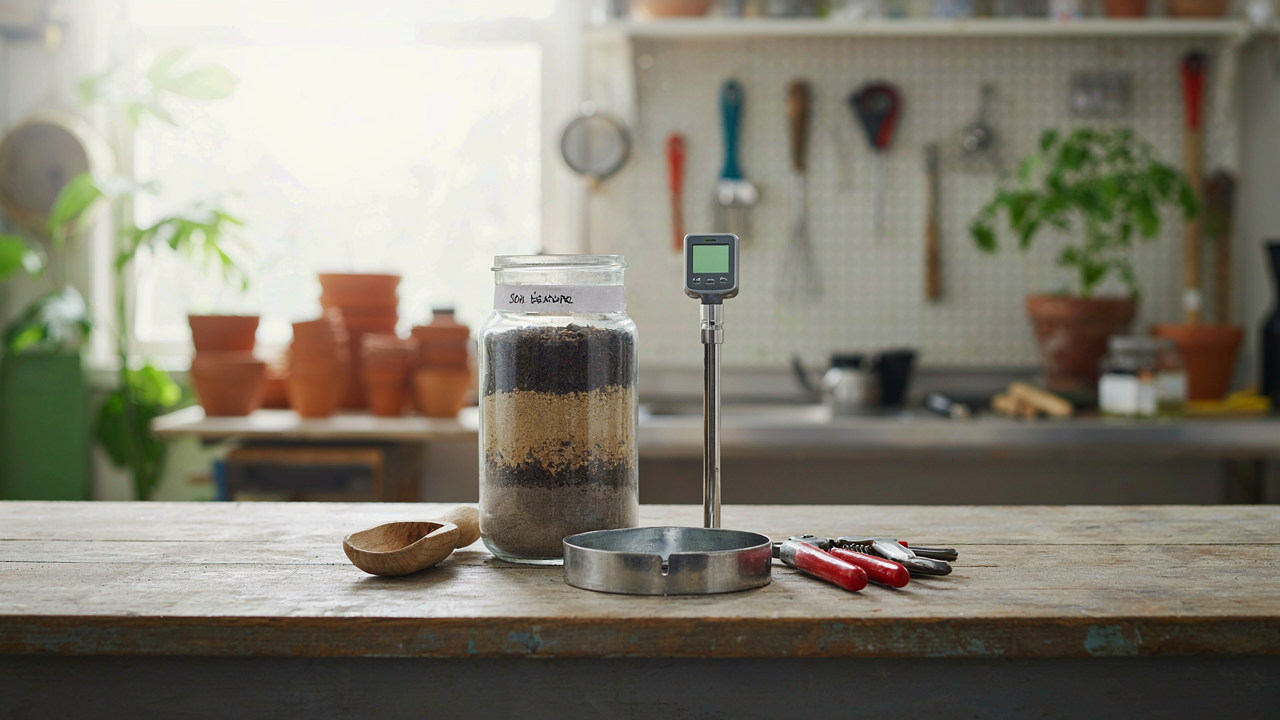
You want to believe a $20 test kit gives you lab results because admitting otherwise means you’ve wasted money and time on guesswork. Here’s the mechanism: most DIY soil tests measure only macro nutrients (nitrogen, phosphorus, potassium) and ignore the extraction method—the chemical solution used to pull nutrients from soil particles. Without controlling extraction chemistry, your numbers mean nothing. Labs use standardized extractants calibrated to your region’s soil type. Your kit uses generic ones.
The gap widens when you factor in soil texture, pH variance, and organic matter interference. A DIY test strip can’t account for how clay particles bind nutrients differently than sand, or how high organic matter creates false readings. Field conditions change between morning and afternoon. Most home testers collect samples inconsistently, varying depth and spot selection. These aren’t minor errors—they’re the difference between accurate diagnosis and expensive crop failure.
When To Trust And When To Question Your Results
Stop trusting DIY results when they contradict observable plant behavior. If your nitrogen reading says adequate but plants show yellowing, one of two things happened: your test is wrong, or a secondary factor (pH lock-out, compaction, drainage) is preventing nutrient uptake. The test itself becomes unreliable once you realize it can’t tell you which problem you’re actually facing. Professional labs don’t just measure nutrients—they interpret them against your crop needs and regional baselines.
Trust DIY tests only for relative trending within your own soil over time. If your phosphorus reads 15 ppm this month and 8 ppm next month, that directional shift is real enough to track, even if absolute values are off. The comparison reveals real changes in your management. Where you must trust professionals: before major investment decisions, when yields drop unexpectedly, or when you’re dealing with contamination concerns. At that point, send samples to a certified lab and request their specific extraction method so results inform actual corrective action.
Beyond PH: The Neglected Metrics Of True Soil Testing
Organic Matter: The Unglamorous Backbone Of Fertility
You want a simple number that tells you if your soil is good. That’s why pH dominates every soil test you’ve seen. But pH is a cosmetic metric. Organic matter is what actually determines whether plants eat or starve.
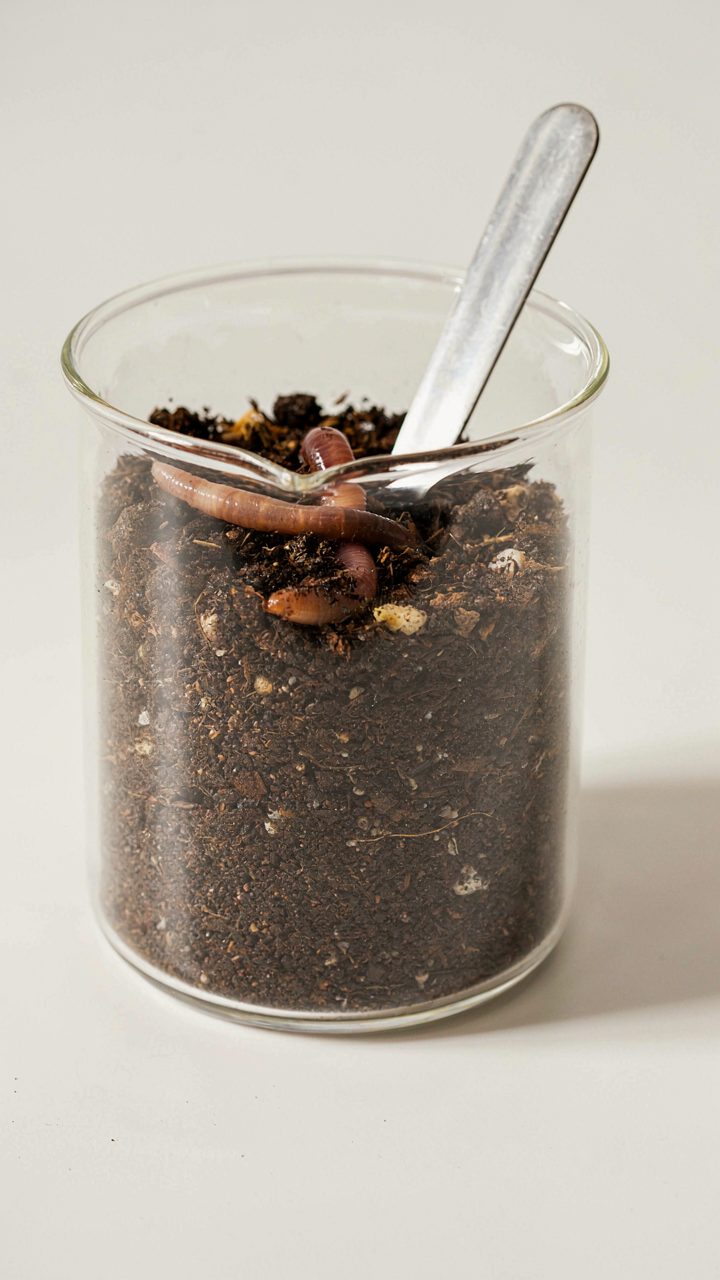
Organic matter is the decomposed plant and animal residue that sits in your soil. It holds water. It feeds microbes. It creates soil structure that lets roots penetrate. A soil testing tool that measures only pH but skips organic matter percentage is designed to sell you lime, not to give you answers. Most commercial kits do exactly this because it’s cheaper to measure one variable than three.
Your soil testing tool needs to quantify organic matter as a percentage of total soil mass. The standard method uses loss on ignition at high temperature, but that’s lab equipment. For field tools, the Walkley-Black method gives you a reliable estimate without burning samples. Measure it. Track it year over year. That number moves slower than pH, which is exactly why it matters more.
Cation Exchange Capacity: Your Soil’s True Nutrient Storage
Borrow the concept from chemistry: cation exchange capacity is like your soil’s credit limit for holding charged nutrients. The higher the CEC, the more calcium, magnesium, potassium, and other cations your soil can retain before they leach away. Soil testing tools that skip CEC are showing you a bank balance without telling you account size.
CEC depends directly on two things: clay content and organic matter. The more of either one you have, the higher your CEC. A sandy soil with 1% organic matter might have a CEC of 3. The same soil with 5% organic matter climbs to 8 or 10. This matters because a nutrient-rich sandy soil with low CEC will lose those nutrients faster than a low-nutrient clay soil with high CEC. Your tool needs to measure this directly or calculate it from texture analysis and organic matter data.
Most soil testing labs provide CEC as standard output because it’s fast to measure electrochemically in the field or lab. If your tool doesn’t report it, demand it. CEC tells you whether your soil can hold onto the nutrients you’re paying to apply. Without it, you’re flying blind on retention and spending money on repeated applications that a higher-CEC soil would keep.
The Minimalist Soil Testing Kit: What You Actually Need
Start With What Moves Data
You want to look like you know soil science without actually committing to the work. Here’s the mechanism: every tool in a real kit solves a specific measurement problem. Most people buy testing kits the way they buy gym memberships—as a status signal, not a system. A pH meter, texture analysis jar, and infiltration ring handle 80 percent of actionable field data. Everything else is friction that delays decisions.
The reason most kits fail is they include instruments that measure the same variable twice or measure variables you’ll never act on. A soil thermometer tells you temperature. That matters for seed germination timing and microbial activity windows. A salinity meter shows dissolved salt load. That drives nutrient availability and water movement. A bulk density tool shows soil compaction. That controls root penetration and drainage. Three tools. Three separate problems. Three different intervention points.
Functionality Over Features And Noise
The gear trap is real, and the soil testing industry built its marketing around it. Sellers position multi-parameter devices as “professional grade” when they’re actually just combining three mediocre sensors into one plastic box that costs three times more. Strip that away. You need instruments that perform one job with precision, not devices that do five things moderately.
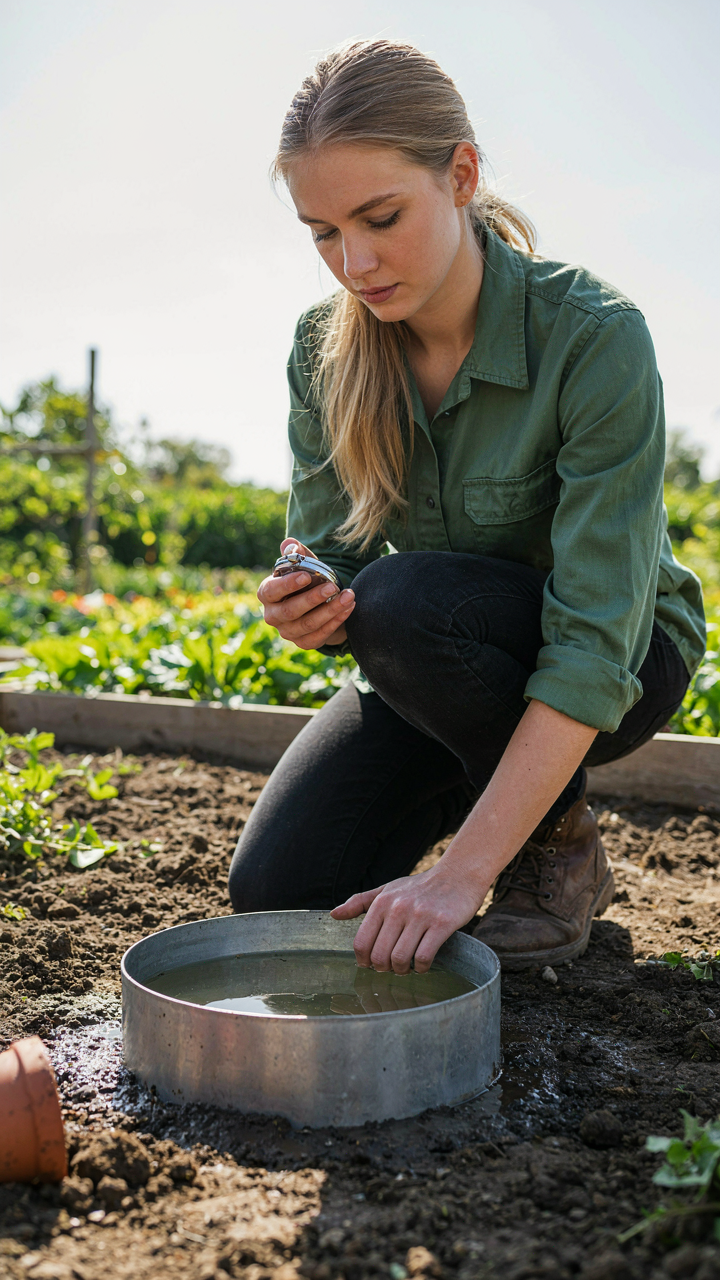
A simple soil texture jar costs eight dollars and works by stratification: sand settles first, silt second, clay last. You can read percentages directly after 24 hours. A mechanical pH probe reads soil acidity without battery dependency. An infiltration ring (literally a metal cylinder you drive into soil) measures water absorption rate by timing how fast water drains. Each tool gives you a number you can use immediately to decide what happens next in that field or garden.
The Unsung Hero: Visual And Olfactory Soil Testing

What Your Soil Color Actually Tells You
You want to skip the lab work and look like you know what you’re doing. Here’s the truth: soil color is a direct readout of composition and biological state, not decoration. Apply stratigraphy—the geological principle of reading layers—to your soil profile. Dark topsoil signals organic matter concentration. Gray or mottled subsoil indicates waterlogging or anaerobic conditions. Red or yellow hues point to iron oxidation and weathering patterns. These aren’t opinions; they’re chemical signatures you can read with your eyes.
Structure matters as much as color. Crumb aggregates mean microbial gluing agents are active. Compacted, blocky soil suggests poor pore space and restricted root penetration. Take a handful after rain and squeeze it. If it holds shape but breaks under light pressure, you’ve got functional aggregation. If it shatters immediately or stays as cement, you know your problem before any test confirms it. This observation takes ninety seconds and eliminates guesswork from your next intervention.
When Soil Smell Reveals What Numbers Hide
Most soil testing advice ignores olfaction because it’s not quantifiable, but biology communicates through volatile compounds. A sour, rotten smell means anaerobic decomposition and sulfide production—your microbial ecosystem has suffocated. Earthy, pleasant odors signal active aerobic respiration and healthy fungal networks producing geosmin, the compound that smells like rain. You’re detecting metabolic output in real time. This is faster feedback than waiting for lab results on microbial respiration rates.
Fresh or musty soil tells you moisture management is working or failing. Ammonia odors indicate nitrogen volatilization from excess urea or manure. Gasoline-like smells suggest contamination or recent chemical application. Build a reference library: test soil samples from known healthy plots, degraded plots, and recently amended plots. Catalog what each smells like. After three or four comparisons, your nose becomes a screening tool that catches problems most farmers miss until crop failure. This is your intake protocol before any instrument touches the sample.
The Soil PH Meter Fallacy: Why It’s Overrated
PH Readings Shift Constantly
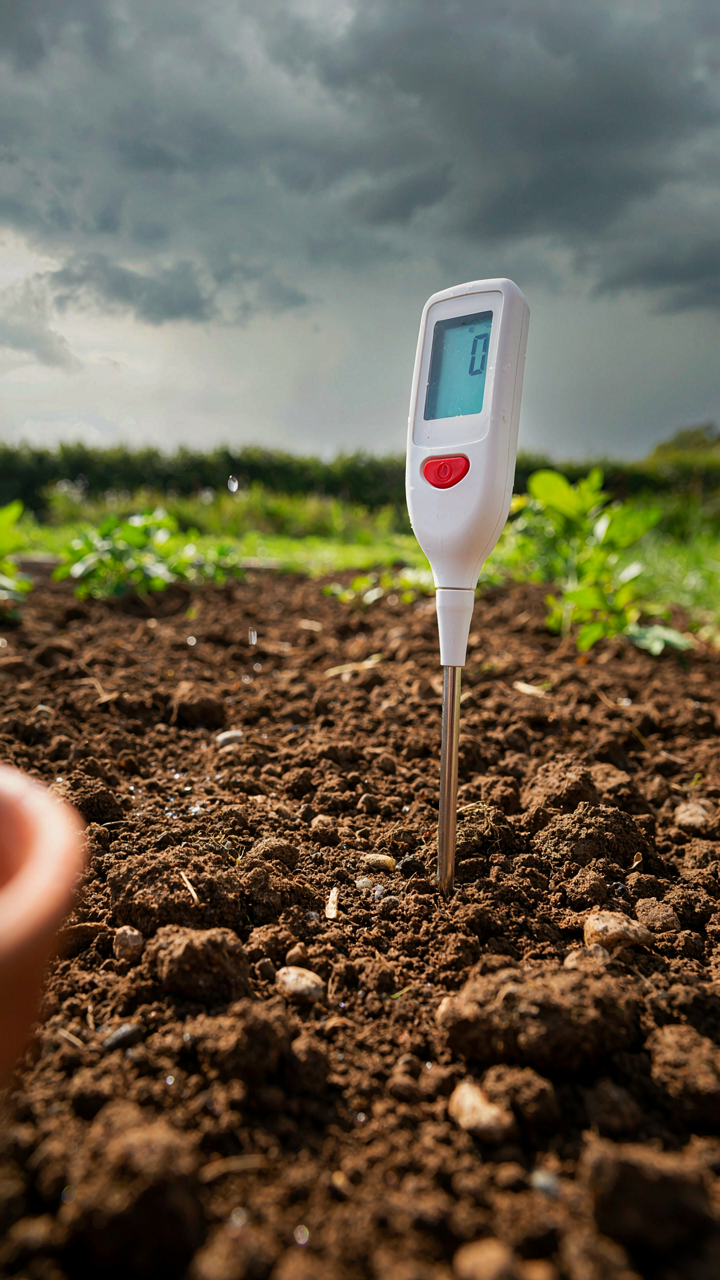
You want a single number to tell you the soil is “fixed.” That’s not how chemistry works. Soil pH fluctuates throughout the day based on moisture, microbial activity, and temperature swings. A reading taken at 8 AM differs from 2 PM. Rain or irrigation drops the number temporarily. Decomposition from organic matter acidifies the profile over hours, not weeks. Most growers miss this because they take one measurement and treat it as permanent data.
The transient nature of pH readings means you’re capturing a moment, not a state. Seasonal variation alone shifts pH by 0.5 to 1.5 units. Wet soil reads differently than dry soil from the same spot. Time of day matters because microbial respiration peaks in afternoon heat, releasing organic acids. This is why agronomists take multiple readings across different times and conditions before making amendment decisions. A single meter reading is not a soil diagnosis. It’s a data point with an expiration date.
Why Context Buries The Actual Signal
The common advice is to “know your soil pH.” That misses the real mechanism. Soil pH interpretation is worthless without knowing soil texture, organic matter content, and which crops you’re growing. Clay soils buffer pH differently than sandy ones. A pH of 6.8 in sandy loam means something completely different than 6.8 in clay loam. Nutrient availability doesn’t track linearly with pH either. Phosphorus availability peaks around 6.0 to 7.0, but only if calcium levels are adequate and aluminum toxicity is absent.
Most pH meter users forget that soil chemistry is a system, not a variable. Aluminum saturation, exchangeable acidity, and base saturation tell you more than pH alone. A soil at pH 5.5 with low aluminum toxicity might need no lime, while another at pH 6.2 with high aluminum might need aggressive amendment. Measure pH alongside calcium, magnesium, potassium, and aluminum. Cross-reference against your crop’s nutrient demand window. Only then does the pH number become actionable data instead of false certainty.
The Practical Precision Protocol For Soil Testing
Where You Actually Collect Samples
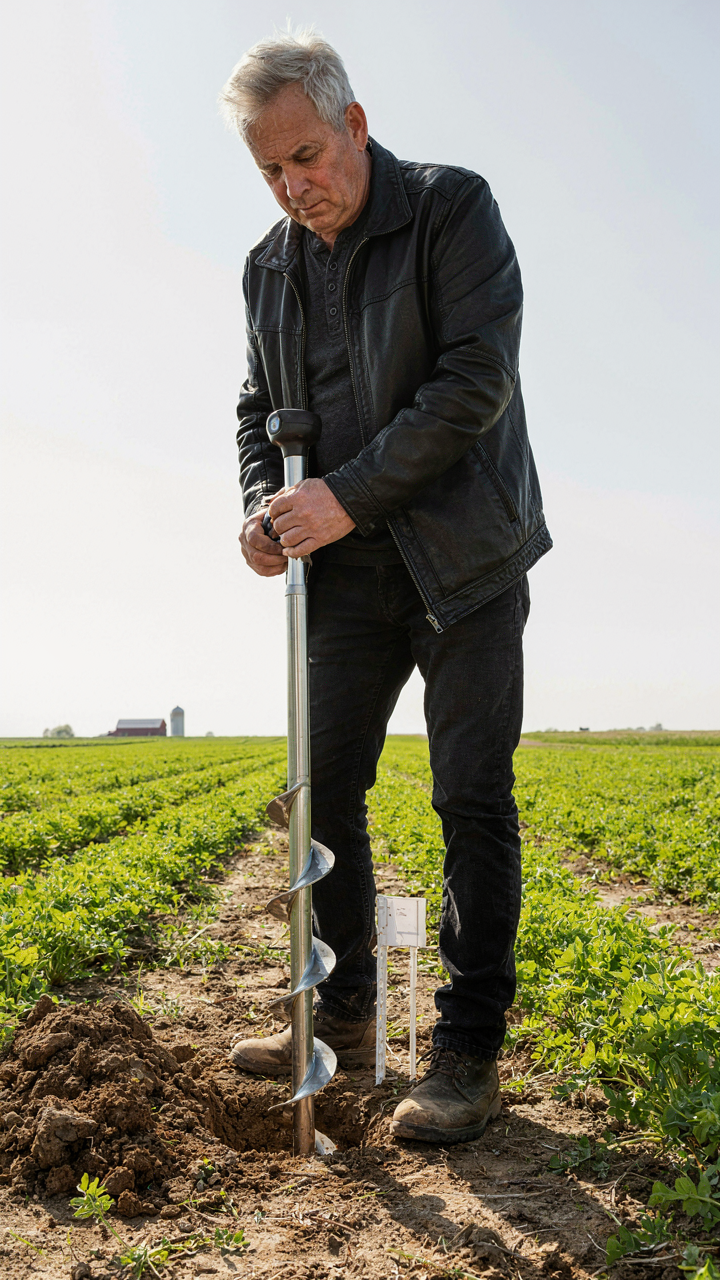
You want reliable data because bad samples kill credibility and waste money on corrections downstream. The real mechanism here borrows from military logistics: concentration of force. In soil testing, this means sampling density. One sample from a five-acre field tells you almost nothing. Spatial variability in soil is the rule, not the exception. Clay content, organic matter, pH, and nutrient levels shift within meters. You need a grid system, not random spots.
The grid density depends on field size and intended crop use. Smaller fields with high-value crops demand tighter grids. A ten-acre vegetable plot needs samples every half-acre. A fifty-acre commodity grain field works at one sample per two acres. Collect samples at consistent depths, typically six to eight inches for most crops. Use the same equipment for each sample to eliminate collection bias. Contamination kills data: clean your auger between samples.
Converting Numbers Into Decisions
Most soil test reports confuse people because they dump raw numbers without context. Soil testing data only matters when it changes what you actually do. Your phosphorus reading of eighteen ppm means nothing until you know your crop’s critical level and your soil’s buffering capacity. Nutrient recommendations must account for soil texture, organic matter content, and field history. A clay loam holds nutrients differently than sandy loam. Previous crop residue and manure applications shift what the soil can supply versus what you need to add.
The actionable step is comparing your test results against established sufficiency ranges for your specific crop and soil type. Extension services publish these ranges by region and soil series. Cross-reference your results, then calculate application rates based on yield goal and nutrient removal rates. Test results guide precision, not guessing. Record every test from every field, every year. This builds your farm’s soil profile over time and reveals what actually works.
Digital Soil Testing Kits: Convenience Vs. Credibility

The Speed Trap Of Instant Readings
You want the answer now because waiting feels like incompetence. Here’s the mechanism: digital soil testers trade calibration precision for user convenience, and most people never notice the drift until their amendment strategy fails halfway through the season. A digital pH meter gives you a number in seconds. A lab test takes days but removes operator error from the equation entirely.
Digital devices measure voltage across a sensor. Soil conditions change that voltage, and the meter converts it to a pH or nutrient value. The problem is calibration. Without it, your device reads relative to its last known state, not absolute truth. Temperature shifts, sensor aging, and mineral buildup all skew the output. You see numbers. You don’t see the decay.
Calibration: The Protocol That Separates Results From Noise
Calibration is borrowed from industrial process control, where deviation tolerance determines product yield. For soil testers, calibration is your anchor to reality—the fixed reference points your device uses to translate raw sensor data into meaningful values. Skip this, and your readings drift into uselessness within weeks.
- Two-point calibration for pH meters: Use buffer solutions at pH 4.0 and 7.0 (or 7.0 and 10.0 depending on your soil range). Measure both, let the device lock those values, and it maps all future readings between them. Recalibrate monthly or after heavy use.
- Storage solution matters: Keep sensors submerged in storage solution between uses, not dry air. Dry sensors develop ion imbalance and read erratically. Most meters include this solution; use it without exception.
- Temperature compensation: Soil conductivity and pH shift with temperature. Quality meters auto-adjust; cheaper ones don’t. If your meter lacks this feature, take all readings at the same time of day to control for thermal drift.
- Conductivity calibration with standards: For nutrient or salinity readings, use calibration solutions at known EC values (usually 1413 microsiemens/cm). Run the same two-point protocol as pH—establish upper and lower anchors.
- Logging your calibration dates: Record when you calibrated and what buffer solutions you used. This creates accountability. If readings suddenly shift, you know how far back to trust your data before recalibrating.
Most users calibrate once at purchase and assume the device stays true forever. This is the error that kills credibility. Calibration drift is silent and continuous. Without a documented protocol, you’re running blind. Establish a monthly calendar reminder tied to your testing routine. Before you test soil samples, run the buffers, lock the values, and only then move to field measurements. This single discipline is what separates a tool from a toy.
The Portable Soil Moisture Meter: A Misunderstood Tool

Water Movement Through Soil Layers
You want a moisture meter because you think it will tell you when to water. It won’t. It tells you where water is right now, which is physics, not permission.
Water moves through soil at different speeds depending on particle size and pore space. Clay holds water but moves it slowly. Sand drains fast. Loam splits the difference. A moisture meter reads the water present, but the real mechanism is hydrodynamics: the study of how fluids move through porous media. When you insert a meter probe, you’re measuring electrical conductivity at that exact point. That conductivity correlates to water content, but only in that layer. The meter doesn’t know what happens six inches below where the probe sits, and it doesn’t predict how water will redistribute over the next twelve hours as gravity and capillary forces shift the moisture profile downward and sideways.
Most users treat the meter reading as a static truth. It isn’t. The reading is a snapshot of one location at one moment. Water in sandy soil keeps moving down rapidly after you water. Water in clay soil moves slower but travels laterally. A meter reading of 40% moisture in clay might mean adequate water for a week. The same reading in sand might mean you have hours before the root zone dries. The mechanism you need to understand is not the number on the screen, but the soil type’s characteristic flow rate and how that interacts with your specific root depth.
Capillary Rise And Real Watering Timing
Stop thinking moisture meters measure “when to water.” They measure whether capillary action is pulling water back up from deeper layers right now.
Capillary action is the physics principle that allows water to move upward against gravity through soil pores. Fine soils like clay and silt have smaller pores and stronger capillary pull. Coarse soils like sand have weak capillary action. A meter reading near the surface tells you whether the soil is holding water from capillary rise or from recent irrigation. In clay soils, water can rise eight to twelve inches or more through capillary action. In sandy soils, capillary rise is negligible, often under two inches. This is why clay soils stay wetter longer at the surface even after drainage stops.
The optimal watering strategy requires knowing your soil type’s capillary height and the depth of your active root zone. If you’re growing plants with shallow roots in clay, capillary action alone might sustain them between waterings. If you’re in sand with deep roots, you’re fighting capillary weakness every time you water. Use the moisture meter as a diagnostic tool: take readings at three depths. Top reading shows surface capillary influence. Middle reading shows the active root zone. Bottom reading shows whether deep water is present. This protocol reveals the actual water distribution pattern. Water when the middle reading drops to 25-30% in your specific soil type, not when any meter hits an arbitrary number.
Building Your Own Soil Testing Legacy, Not Just A Kit

Match Your Tools To What Actually Grows There
You want to feel like you’ve solved the problem without doing the work. That’s the real reason this section matters. Here’s the mechanism: soil varies by geography, parent material, and climate history. A testing tool designed for alkaline clay in the Southwest fails in acidic sandy soils of the Southeast. Borrowing from systems design, you need to treat regional soil profiles as distinct operating environments, not variations of a single baseline.
The common approach is to buy a universal kit and assume it works everywhere. It doesn’t. Your tools must match local soil conditions or they measure noise instead of signal. Start by mapping your region’s dominant soil series through the USDA NRCS Web Soil Survey. Identify the parent material, pH range, texture class, and drainage patterns for your area. Build or customize your testing tools around those specific parameters. A refractometer works brilliantly for measuring dissolved solids in well-draining soils but gives misleading readings in waterlogged clay.
Extract Real Data With Materials You Already Have
Most people think DIY soil testing means buying cheaper versions of lab equipment and accepting lower accuracy. Wrong. Simple materials often capture the mechanism more directly than expensive black boxes do. Glass bottles, a scale, water, and timing pins reveal soil compaction, drainage rate, and organic matter presence without electronic interference or calibration drift.
The Jar Test exposes soil structure in layers using only water, a clear container, and observation. Fill a mason jar with soil, add water, shake it hard, then watch the separation over 24 hours. Sand settles first, silt second, clay last. This single protocol tells you texture, which determines water retention and nutrient availability. For drainage rate, use a PVC pipe, ruler, and a known volume of water. Push the pipe into undisturbed soil, pour water through it, measure how fast the level drops. You now have an infiltration rate without hiring a technician.
Beyond The Buzzwords: Real Soil Health Indicators
The Microbial Network Driving Soil Vitality
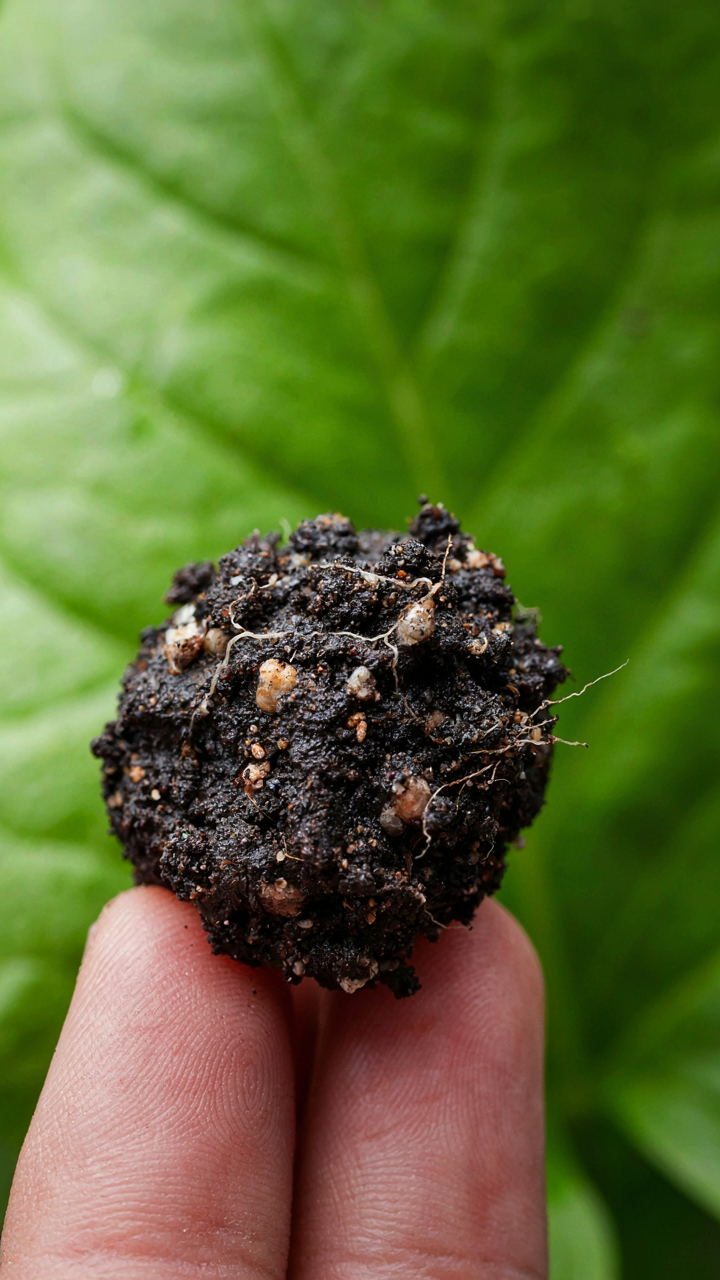
You want soil testing tools that prove your land is better than your neighbor’s. That’s not wrong, but it’s not what matters. Soil biology works like an immune system: bacteria, fungi, and protozoa form a network that processes nutrients, suppresses disease, and builds structure. Most testing tools ignore this entirely and measure only chemistry.
Standard soil tests tell you NPK levels and pH. They don’t tell you if microbes can access those nutrients or convert them into plant-available forms. A soil can have adequate phosphorus on paper while microbial populations collapse from tillage or salt stress. Your testing tool must measure microbial respiration or enzyme activity to know if the biology is functioning. These indicators reveal whether your soil is alive or just a growing medium pretending to be alive.
Tracking Genuine Soil Evolution
Long-term observation beats a single snapshot. Most farmers test soil once a year and chase the numbers. That’s reactive management. The real mechanism is trend recognition: watching how your soil responds to management over three to five years reveals what actually works in your specific context.
Soil changes slowly. Organic matter builds at roughly 0.1 to 0.3 percent per year under good management. Microbial diversity recovery takes two to three years after disturbance. Your testing protocol must include the same sampling depth, timing, and weather conditions each time to isolate the effect of your decisions from natural variation. Track aggregate stability, water infiltration, and carbon levels year to year. When your data shows consistent movement in one direction, you’ve found the mechanism that works. Stop testing randomly and start building a soil archive.
The Obsession With Stunning Tools Blinds You To The Fundamental Mechanisms Of Soil Health

Most people buy the fanciest soil testing kit and never use it. They confuse the tool with the work. A gorgeous device collecting dust teaches you nothing. Your job today is simple: pull soil from three different spots in your yard, test it with whatever you have, and write down the numbers. Stop waiting for perfection. The tool doesn’t matter. The data you actually collect does.